I am currently working with laboratory data and using LOINC codes for parameter identification. My question is:
Is there a standardized or unified reference range associated with LOINC codes that could be used as a general guideline to classify values as low, normal, or high?
Or are the reference intervals expected to be provided individually by the submitting organization or laboratory for each measurement?
Any clarification on how reference intervals are handled in the context of LOINC-coded data would be highly appreciated.
The short answer is reference ranges are not associated with LOINCs. In the US CLIA and globally usually ISO regulations require each (performing) laboratory to determine the reference ranges for their patient population.
If you are looking for interpretations of reference ranges as low, high,critical high, critical low etc., these are also usually provided where applicable by the performing laboratory for result values.
In recent decade, tools and knowledge bases for Data Quality Assessment (DQA) emerged that identify implausible data rows in healthcare observational databases. A tool developed by Observational Health Data Sciences and Informatics (OHDSI) community called Data Quality Dashboard (DQD) contains expert-driven knowledge base (KB) with maximum and minimum thresholds for checking plausibility of values for laboratory tests values that are coded in LOINC (Logical Observation Identifiers Names and Codes).
Methods
We first evaluated existing DQD expert-driven thresholds KB in terms of coverage, development effort and consistency. Next, we designed a network study to extract aggregated data (per lab test-unit pair) from multiple sites and used the data to inform development of possible DQA methods. We designed and evaluated several methods for creating a data-driven KB for laboratory data DQA. Method 1 consisted of producing KB with percentile values and other benchmark data and checking whether evaluated dataset has significantly different percentile values. Method 2 consisted of splitting threshold into two thresholds: extreme and plausible thresholds (for min and max). The extreme value was based on finding that at some sites we saw extreme values (e.g., 9999; referred to as special-meaning-numerical-value or semantic value) present in the data and extreme threshold was a possible method how to identify semantic values across many datasets and lab-unit pairs. It was easier to achieve some consensus for extreme value methodology (based on formula of 1st/99th percentile ± standard deviation) among DQD developers compared to plausible thresholds. Finally, since we evaluated expert-driven KB for consistency across convertible units, we have also created and tested an additional knowledge base that facilitates unit conversions.
Results and Discussion
The evaluation of the expert-driven KB showed the following: (1) OMOP datasets contain lab results not covered by expert-driven KB (330 distinct lab test present in expert-driven KB; 5,943 lab tests observed in network study); (2) development requires significant resources (several hours to review of hundreds of thresholds, need for multiple specialty expertise and expert consensus); (3) for some tests, thresholds values do not agree when defined for multiple units (convertible into each other). In the OHDSI network study (study repository at GitHub - vojtechhuser/DataQuality · GitHub) we collected data from six OHDSI sites. The benchmark KB has data on 1,350 lab-unit pairs (data from 2+ sites; full KB has 5,943 lab-unit pairs). Study repository contains the benchmark KB together with additional results (see extras/DqdResults), such as ranked list of common lab tests. The full data-driven KB contains data on additional 3,993 distinct lab tests not covered by the existing expert-driven KB (12.1 times more) and can facilitate a more comprehensive DQA. The most optimal DQA approach may involve combination of data driven approach followed by (or combined with) expert review. Besides planned integration into OHDSI DQD tool, our KB is self-standing and can be used by other data models (we have developed an R script for PCORNet CDM). Limitations: Our results are limited by the fact that only 6 sites contributed data. Acknowledgement: This research was supported by the Intramural Research Program of the National Institutes of Health (NIH)/National Library of Medicine (NLM)/Lister Hill National Center for Biomedical Communications (LHNCBC).
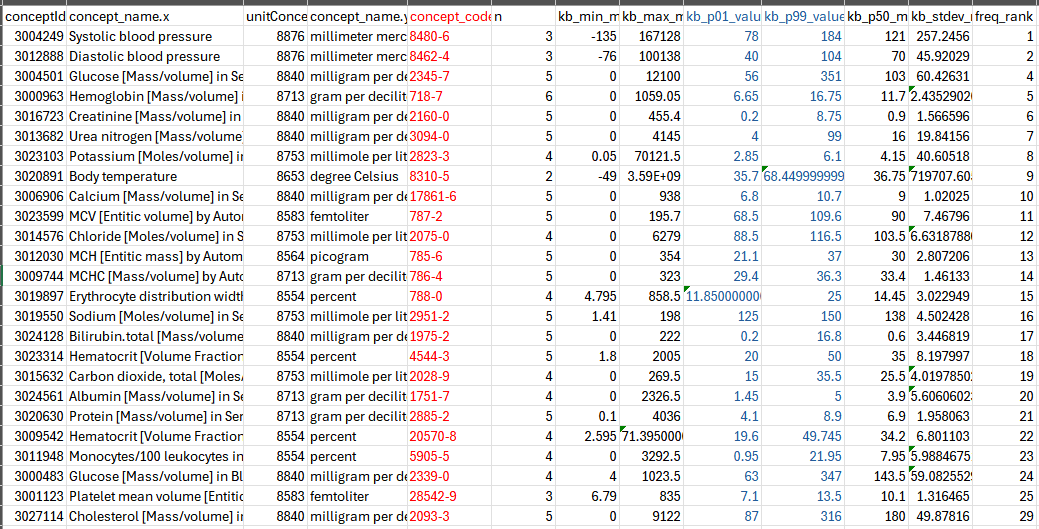
2800+ loinc lab tests (LOINC code in red) ranked with min and max values (in blue)